Sample: audit of my own product, itiner.in, 10 Oct 2026
Speed + AI-search audit: itiner.in
Prepared by Daksh Bathla · Navital Labs (sole proprietorship, MSME-registered, India). AI-assisted: the measurements are run by scripts; I review every finding.
Pages audited: /, /pricing, /features, /vs/travefy, /itinerary-templates/bali-honeymoon-7-days. This is a sample so you can see the format and depth of the real deliverable. itiner.in is my own product; a client report has the same sections.
Summary
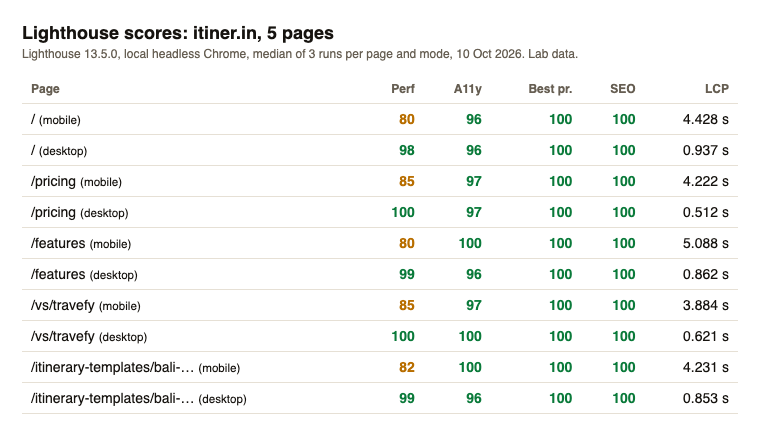
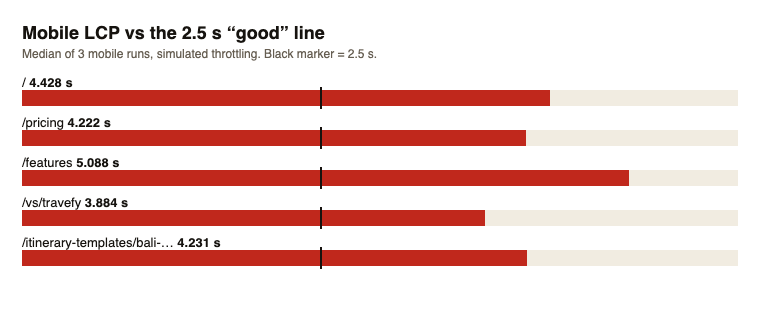
Itiner's technical basics are in good shape: every audited page scores 100 for SEO and for best practices on both mobile and desktop, desktop performance is 98-100, pages are server-rendered with structured data, and crawlers are allowed (including the AI crawlers named in robots.txt). The weak spot is mobile loading speed: Largest Contentful Paint is 3.884-5.088 s on all five pages against a 2.5 s "good" threshold. On /, /pricing, /vs/travefy element render delay is the largest part of Lighthouse's LCP breakdown (66%, 78%, 88%). Five issues cleared the thresholds on this site. This is lab data from one day; it says nothing about rankings or traffic.
Measured numbers
Lighthouse 13.5.0, local headless Chrome. Mobile runs use Lighthouse's simulated slow-4G network and slowed CPU; desktop runs use its desktop settings. Median of 3 runs for mobile and for desktop. Lab data, not field data.
| Page | Mode | Runs | Perf | A11y | Best practices | SEO | LCP | CLS | TBT | Page weight |
|---|---|---|---|---|---|---|---|---|---|---|
| / | mobile | 3 | 80 | 96 | 100 | 100 | 4.428 s | 0 | 24 ms | 644 KiB |
| / | desktop | 3 | 98 | 96 | 100 | 100 | 0.937 s | 0.0 | 0 ms | 753 KiB |
| /pricing | mobile | 3 | 85 | 97 | 100 | 100 | 4.222 s | 0 | 7 ms | 628 KiB |
| /pricing | desktop | 3 | 100 | 97 | 100 | 100 | 0.512 s | 0 | 0 ms | 669 KiB |
| /features | mobile | 3 | 80 | 100 | 100 | 100 | 5.088 s | 0.073 | 4 ms | 691 KiB |
| /features | desktop | 3 | 99 | 96 | 100 | 100 | 0.862 s | 0.002 | 0 ms | 735 KiB |
| /vs/travefy | mobile | 3 | 85 | 97 | 100 | 100 | 3.884 s | 0 | 7 ms | 553 KiB |
| /vs/travefy | desktop | 3 | 100 | 100 | 100 | 100 | 0.621 s | 0.001 | 0 ms | 590 KiB |
| /itinerary-templates/bali-honeymoon-7-days | mobile | 3 | 82 | 100 | 100 | 100 | 4.231 s | 0 | 10 ms | 695 KiB |
| /itinerary-templates/bali-honeymoon-7-days | desktop | 3 | 99 | 96 | 100 | 100 | 0.853 s | 0 | 0 ms | 860 KiB |
Comparison with my earlier run on 8 Oct 2026 (a single run per page; today's numbers are the median of 3, so small differences are noise):
| Page | 8 Oct mobile Perf / LCP | 10 Oct mobile Perf / LCP | 8 Oct desktop Perf | 10 Oct desktop Perf |
|---|---|---|---|---|
| / | 80 / 5.3 s | 80 / 4.428 s | 99 | 98 |
| /pricing | 82 / 4.3 s | 85 / 4.222 s | 99 | 100 |
| /features | 78 / 5.5 s | 80 / 5.088 s | 88 | 99 |
| /vs/travefy | 82 / 4.3 s | 85 / 3.884 s | 100 | 100 |
| /itinerary-templates/bali-honeymoon-7-days | 68 / 6.6 s | 82 / 4.231 s | 97 | 99 |
The consistent finding is unchanged: mobile LCP is above 2.5 s on every page. The site may have changed between the two dates.
Top issues, ranked by impact x effort
Ranking key: impact (1-5) x (6 - effort 1-5). It is a review order, not a promise of any search ranking or traffic outcome. Five issues cleared the thresholds on this site.
1. Mobile LCP is 3.884-5.088 s (good is <= 2.5 s) (on 5 pages: /, /pricing, /features, /vs/travefy, /itinerary-templates/bali-honeymoon-7-days)
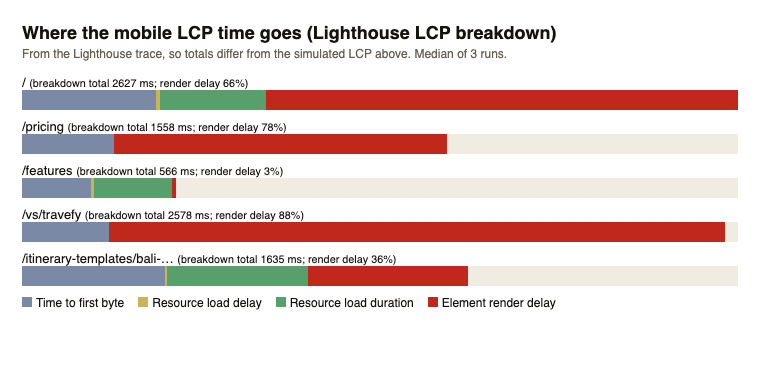
- Evidence: Mobile, median of 3 runs. /: LCP 4.428 s, performance 80; largest element is a large image; in Lighthouse's LCP breakdown, element render delay is 66% (server response 493 ms, resource load 403 ms, render delay 1731 ms); /pricing: LCP 4.222 s, performance 85; largest element is the intro paragraph; in Lighthouse's LCP breakdown, element render delay is 78% (server response 338 ms, resource load 0 ms, render delay 1220 ms); /features: LCP 5.088 s, performance 80; largest element is a large image; in Lighthouse's LCP breakdown, element render delay is 3% (server response 252 ms, resource load 297 ms, render delay 17 ms); /vs/travefy: LCP 3.884 s, performance 85; largest element is the intro paragraph; in Lighthouse's LCP breakdown, element render delay is 88% (server response 320 ms, resource load 0 ms, render delay 2258 ms); /itinerary-templates/bali-honeymoon-7-days: LCP 4.231 s, performance 82; largest element is a large image; in Lighthouse's LCP breakdown, element render delay is 36% (server response 523 ms, resource load 527 ms, render delay 585 ms). The breakdown comes from Lighthouse's trace, so its total differs from the simulated LCP.
- Why it matters: LCP is a Core Web Vital; slow loading on a phone is the first thing a visitor feels and Google's page-experience guidance asks for <= 2.5 s.
- How hard: effort 3/5, impact 5/5. How to fix: On /, /pricing, /vs/travefy most of Lighthouse's LCP breakdown is element render delay (paint blocked: render-blocking CSS/JS, hydration, animation wrappers, third-party scripts). On /features, /itinerary-templates/bali-honeymoon-7-days it is not; there the large LCP element under mobile throttling is the likely cost, so check its size and format first.
- Rough fix size: 0.5-2 days
2. 12 images without width/height (8 on /, 4 on /itinerary-templates/bali-honeymoon-7-days)
- Evidence: Images with no width and height attributes in the HTML: 8 of 13 on /, 4 of 6 on /itinerary-templates/bali-honeymoon-7-days. Without them the browser cannot reserve space before the image loads.
- Why it matters: Missing dimensions let the layout jump as images load.
- How hard: effort 1/5, impact 3/5. How to fix: Add width/height or aspect-ratio.
- Rough fix size: 1-2 hours
3. Accessibility checks flagged: colour contrast (2 pages), link styling (1 page)
- Evidence: Lighthouse's automated accessibility checks flagged: colour contrast on /, /pricing; link styling on /vs/travefy.
- Why it matters: Accessibility defects exclude users and carry legal risk in some markets.
- How hard: effort 2/5, impact 3/5. How to fix: Fix the flagged colour contrast and link styling (for example by changing text colours or underlining links inside paragraphs), then re-run the checks.
- Rough fix size: 2-8 hours
4. Small layout shift (CLS 0.073) on /features
- Evidence: Cumulative layout shift is 0.073 on /features (mobile median of 3). Under 0.1 counts as good, so this is minor.
- Why it matters: Small shifts are within the 'good' band; worth fixing while touching the page.
- How hard: effort 2/5, impact 2/5. How to fix: Reserve space for the element that moves.
- Rough fix size: 1-2 hours
5. About 79 KiB of unused JavaScript (on 5 pages: /, /pricing, /features, /vs/travefy, /itinerary-templates/bali-honeymoon-7-days)
- Evidence: Lighthouse reports about 79-81 KiB of JavaScript that is downloaded but not used on each audited page (mobile).
- Why it matters: Unused JavaScript is still downloaded and parsed on a phone, though at this size the effect is small.
- How hard: effort 3/5, impact 2/5. How to fix: Code-split by route and drop unused libraries.
- Rough fix size: 0.5-1 day
Crawl and AI-readability checks
- robots.txt: 200; AI crawlers blocked: none; AI crawlers named: GPTBot, OAI-SearchBot, ChatGPT-User, ClaudeBot, Claude-SearchBot, anthropic-ai, PerplexityBot, Google-Extended, Applebot-Extended
- sitemap: 200, 98 URLs; a sample of 10 URLs: 0 returned a non-200 status
- llms.txt: 200; llms-full.txt: 200
- an unknown URL returns 404; redirect hops: www variant 0, http variant 0
- structured data (JSON-LD) found on the home page: Answer, ContactPoint, FAQPage, Offer, Organization, Person, Place, PostalAddress, QuantitativeValue, Question, SoftwareApplication, UnitPriceSpecification; no parse errors on the audited pages
AI answers check
Not run in this sample. In a client audit this is a manual step: 3 queries in ChatGPT and Perplexity, recorded by hand with the date, the exact query text and what each answer said. No results are claimed here.
What was not measured
- Field data (real-user Core Web Vitals): needs a CrUX/PSI key or the site's own analytics.
- Lab data from one day; numbers vary run to run (median of the runs shown).
- Accessibility is Lighthouse's automated axe subset only, not a full accessibility audit.
- Only the five pages above were speed-tested; anything behind a login was not.
- No ranking, traffic or revenue outcome is promised or implied by this report.
Next step: fix sprint
Fix sprint: $1,200, 5 working days. Fixes the top issues above and ends with a before/after report using the same method. The $400 audit fee is credited if you book the sprint within 14 days. I use AI coding tools in delivery and review everything shipped. Full terms: dakshbathla.in/hire